Exploit Chain Mapping: What It Is and Why It Matters
Most code scanners answer the question "where does this pattern appear?" That is a useful question. It is not the question a security team actually has, which is: if someone attacked this application tomorrow, what would they get through?
A finding is not a risk
Run a conventional scanner over a mature codebase and you get hundreds of results. Some are real. Most are reachable only from code paths that no user can trigger, or guarded by a validation step three functions upstream that the scanner never looked at. The output is technically accurate and practically unusable, because it ranks by pattern severity rather than by whether the pattern can be reached.
That is how teams end up with a backlog of four hundred criticals that nobody has triaged, while the one genuinely exploitable path sits at position 213 because its individual pattern scores as "medium".
What an exploit chain is
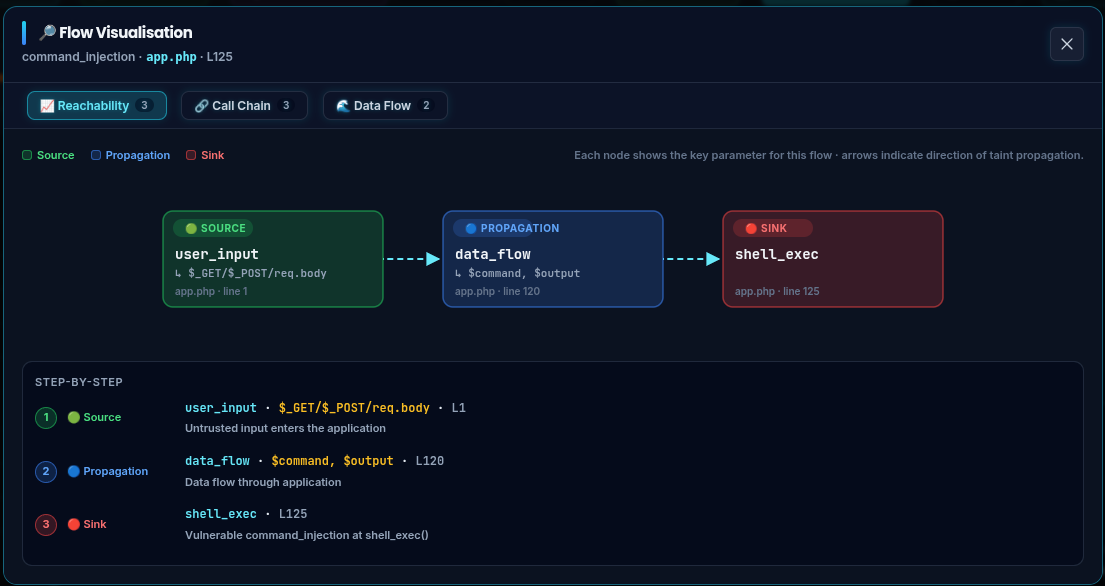
An exploit chain is the actual route from something an attacker controls to something dangerous. It has three parts:
- A source — a request parameter, an uploaded file, a message off a queue: anything the attacker influences.
- A path — the assignments, function calls and transformations the value passes through on its way.
- A sink — the operation where it does damage: a query, a shell command, a file write, a deserialisation.
A finding with a source and a sink but no traceable path between them is a hypothesis. A finding with all three is a bug you can demonstrate.
Why the path is the hard part
Identifying sources and sinks is close to a lookup problem: there is a finite list of dangerous functions per language. The path is where the analysis gets difficult, because real code moves values through fields, containers, callbacks and framework indirection. Any analysis that gives up at the first function boundary will report the easy cases and miss the interesting ones — and the interesting ones are the reason anyone runs the tool.
It also has to recognise when a value stops being dangerous. A parameter that passes through a parameterised query builder or a real escaping function is no longer a threat, and reporting it is how a tool teaches its users to ignore it.
What changes when you have the chain
Three things, in our experience:
The order of the backlog changes. Ranking by reachability rather than by pattern severity usually reshuffles the top twenty completely. The items that rise are the ones an attacker would find first.
Arguments end faster. "This is a false positive" and "no, it's real" is an expensive conversation to have from a rule name alone. It is a short conversation when the report shows the specific route, line by line.
Fixes get cheaper. Several findings often share one path. Cutting the chain at the right point closes all of them, which is a very different piece of work from patching each reported line.
How Blue Sentinel does it
Blue Sentinel runs several analyses over the same code — lexical, AST, control-flow, dataflow, taint and pattern — and reconciles them. Taint tracing supplies the paths; the other engines supply the context that decides whether a path matters. Findings are then ordered by exploitability rather than by raw severity, and each one ships with the route that produced it.
See it on your own code.
An assessment takes your source and returns the chains, not just the findings.